


Introduction
In the fast-paced world of forex trading, the mantra “The trend is your friend” holds significant weight. One effective approach is the Trend Following Strategy, which highlights the need to align trades with the current market direction. Doing this can increase profits and reduce risks.
Trend-following strategies use market momentum. This helps traders take advantage of ongoing price movements instead of betting against them.
This guide looks closely at trend-following strategies. It explores the tools, indicators, and steps needed to use this trading method well. By the end of this article, you will understand how to use trends to improve your forex trading.
Understanding Trends in Forex Trading
A market trend reflects the general direction of an asset’s price movement over a specific period. Broadly categorized into three types, trends can:
- Uptrend (Bullish): A sequence of higher highs and higher lows, indicating growing buying pressure.
- Downtrend (Bearish): A pattern of lower highs and lower lows, signifying increasing selling pressure.
- Sideways Trend (Ranging): A horizontal movement where prices oscillate between support and resistance levels.
Identifying these trends accurately is the cornerstone of a trend-following strategy. Traders try to match their positions with the current trend. They buy when the market is going up and sell when it is going down. They also work to avoid false signals in flat markets.
Essential Tools and Indicators for Trend Following Strategy
Modern trading platforms offer a suite of tools and indicators to help traders identify and confirm trends. The most popular ones include:
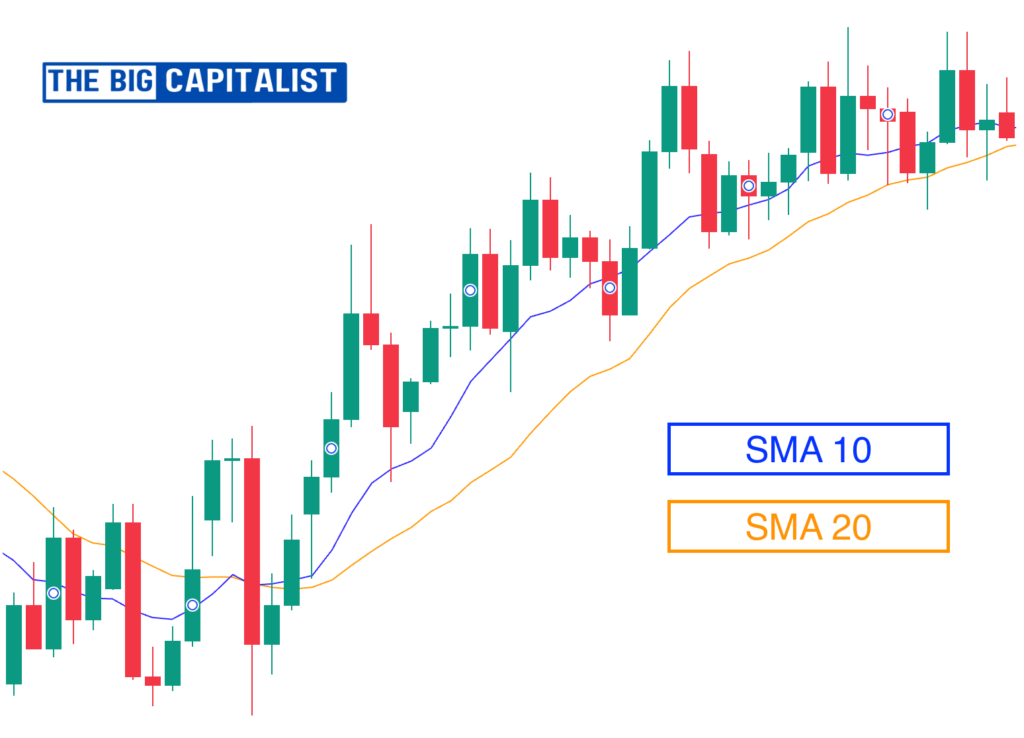
1. Moving Averages (MA)
Moving averages are important tools in technical analysis. They help smooth out price data. This gives traders a clearer view of the market’s trend direction. By filtering out short-term price fluctuations, they highlight the underlying trend.
- Simple Moving Average (SMA): This measures the average price of an asset over a set time. It gives equal importance to all data points.
- Exponential Moving Average (EMA): The EMA focuses more on recent prices than the Simple Moving Average (SMA). This makes it quicker to react to current market changes.

Usage:
- Employ a 50-day and 200-day moving average crossover to validate long-term trends:
- A bullish crossover (when the short-term MA crosses above the long-term MA) signals an uptrend, often referred to as a “golden cross.”
- A bearish crossover (when the short-term MA crosses below the long-term MA) suggests a downtrend, known as a “death cross.”
- Combine moving averages with other indicators for enhanced confirmation of trend strength.
2. Moving Average Convergence Divergence (MACD)

The MACD is a versatile momentum oscillator that helps traders assess both the strength and direction of a trend. It consists of three key components:
- MACD Line: The difference between the 12-day EMA and the 26-day EMA.
- Signal Line: A 9-day EMA of the MACD line, used to trigger buy or sell signals.
- Histogram: It shows the difference between the MACD line and the signal line. This makes it easy to see changes in momentum.
Usage:
- When the MACD line crosses above the signal line, it indicates bullish momentum and a potential uptrend.
- Conversely, when the MACD line crosses below the signal line, it suggests bearish momentum and a possible downtrend.
- Look for divergences between the MACD and price movements to spot potential trend reversals.
3. Relative Strength Index (RSI)
The RSI is a momentum tool. It measures how fast and how much prices have changed recently. This helps traders find overbought or oversold conditions. It ranges from 0 to 100.
- Readings above 70 show overbought conditions. This means the asset might need a price correction or a change in an uptrend.
- Readings below 30 show oversold conditions. This means that the market may undervalue the asset, making it ready to reverse in a downtrend.
Usage:
- Combine RSI with trendlines or moving averages for more reliable trade signals.
- Use RSI divergence (when price moves in the opposite direction of RSI) to anticipate potential trend reversals.
4. Trendlines
Trendlines are a straightforward yet powerful tool for identifying and confirming trends. By connecting consecutive highs or lows, they visually represent the trajectory of the market’s movement.
- Upward Trendline: Connects higher lows, acting as a support level during an uptrend. As long as the price stays above the trendline, the uptrend remains intact.
- Downward Trendline: Connects lower highs, serving as a resistance level during a downtrend. The trend remains valid as long as the price stays below the trendline.
Usage:
- Use trendlines to find breakout points. These points occur when the price moves clearly above or below the line. This movement can signal a possible trend reversal or continuation.
- Combine trendlines with indicators like MACD or RSI to enhance trade accuracy and avoid false signals.
Steps to Execute a Trend-Following Strategy
1. Identify the Primary Trend
Begin by analyzing the market’s overall direction using tools like moving averages, trendlines, or the MACD. Ensure the trend is well-established to avoid entering trades during periods of market indecision.
2. Time Your Entry
Timing is crucial in trend following. Look for entry points when the price aligns with the trend’s momentum:
- Buy near support levels during an uptrend.
- Sell near resistance levels during a downtrend.
- Confirm your entry using indicators like RSI to avoid entering overbought or oversold zones.
3. Set Stop-Loss Orders
Protect your capital by setting stop-loss orders:
- Place stop-losses slightly below recent lows in an uptrend.
- Place stop-losses slightly above recent highs in a downtrend.
- Trailing stop-losses can help lock in profits as the trend progresses.
4. Ride the Trend
Once in a trade, resist the temptation to exit prematurely. Let the trend play out while monitoring key levels and indicators for signs of reversal. Patience is often rewarded in trend-following strategies.
5. Exit Strategically
Exiting a trade is as important as entering it. Use a combination of:
- Trailing Stops: Gradually move the stop-loss order as the trend progresses.
- Profit Targets: Set realistic profit targets based on historical price levels or Fibonacci extensions.
- Indicator Signals: Exit when indicators like MACD or RSI suggest waning momentum.
As a trader, I’ve had my share of missed opportunities and hard lessons. One memorable instance involved the EUR/USD pair. Despite clear indications of an uptrend, I hesitated, fearing a reversal. Watching the pair climb steadily while I remained on the sidelines was a humbling experience.
That day, I learned the value of trusting the trend and adhering to my analysis. This experience cemented my belief that the market rewards discipline and courage.
Common Mistakes in Trend Following
Trend-following strategies are highly effective when executed correctly, but even seasoned traders can fall victim to common pitfalls. Awareness of these mistakes and taking proactive steps to avoid them can significantly improve your trading outcomes.
1. Ignoring the Big Picture
Focusing solely on short-term trends while neglecting the broader market context is a frequent error among traders. Without understanding the overarching trend, you risk entering trades that conflict with the larger market movement.
How to Avoid:
- Always perform a multiple timeframe analysis to ensure that your trade aligns with both the short-term and long-term trends.
- Monitor economic news, geopolitical events, and market sentiment to understand the factors driving the trend.
2. Overloading on Indicators
Using too many technical indicators can lead to analysis paralysis, where conflicting signals make decision-making difficult. This often results in missed opportunities or poorly timed trades.
How to Avoid:
- Stick to a core set of indicators that complement each other, such as moving averages, MACD, and RSI.
- Focus on mastering a few tools rather than trying to use everything available.
- Keep your trading charts clean and uncluttered to maintain clarity.
3. Chasing Trends
Jumping into a trade too late in the trend is a common mistake, often driven by fear of missing out (FOMO). This method raises the chance of entering close to a trend’s end point. This can lead to lower returns or losses from sudden changes.
How to Avoid:
- Identify early trend signals using tools like trendlines, moving average crossovers, or MACD.
- Practice patience and wait for a pullback or retracement to a key support/resistance level before entering the trade.
- Use a trading journal to analyze past trades and recognize patterns of impulsive decision-making.
4. Overlooking Risk Management
No trading strategy is foolproof, and failing to manage risk effectively can lead to significant financial losses. Without stop-loss orders or good position sizing, one trade can take away a large part of your account.
How to Avoid:
- Always set a stop-loss order at a logical level based on your analysis.
- Use the 1-2% rule to limit the amount of capital risked per trade.
- Regularly review and adjust your risk management strategy as your trading account grows or market conditions change.
By fixing these common mistakes, you can improve your trend-following strategy. This will help you create a more disciplined and effective trading plan.
Advanced Trend-Following Techniques
1. Multiple Timeframe Analysis
Analyze trends across different timeframes:
- Use higher timeframes (daily, weekly) to identify the primary trend.
- Use lower timeframes (hourly, 15-minute) for precise entry and exit points.
2. Fibonacci Retracements and Extensions
Fibonacci tools help identify potential support and resistance levels:
- Retracements highlight areas where the price may pull back before resuming the trend.
- Extensions provide potential targets for trend continuation.
3. Combining Fundamentals with Technicals
While trend-following is primarily technical, integrating fundamental analysis can enhance decision-making. Economic data, central bank policies, and geopolitical events often influence trends.
4. Algorithmic Trend Following
Advanced traders may use automated systems to execute trend-following strategies. These systems leverage predefined rules, reducing emotional biases and enhancing consistency.
Case Study: Trend Following in Action
Imagine a scenario where the GBP/USD pair exhibits a strong uptrend. Here’s how a trader could implement a trend-following strategy:
- Identifying the Trend: Using a 50-day and 200-day moving average, the trader confirms a bullish crossover, indicating an uptrend.
- Entering the Trade: The trader buys when the price goes back to the 50-day moving average. This is backed by strong RSI levels.
- Place a stop-loss just below the recent swing low to protect against sudden reversals.
- Riding the Trend: The trader monitors the trade, adjusting the stop-loss as the price climbs.
- Exiting Strategically: The position is closed when the MACD shows bearish divergence, signaling a potential trend reversal.
This structured approach ensures disciplined trading and optimized risk-reward ratios.
Conclusion:Trend Following Strategy
Trend-following strategies are a cornerstone of successful forex trading. By following the market’s natural trends, traders can boost their chances of making a profit.
This also helps reduce emotional decision-making. Whether you are a beginner or an experienced trader, mastering trend following takes patience and discipline. You must also be willing to learn from both your successes and failures.
With the right tools, techniques, and mindset, you too can make “The trend is your friend” a guiding principle in your trading journey. Start by implementing the steps outlined in this guide, and watch as your trading results improve over time.
FAQs
- Uptrend (Bullish): Higher highs and higher lows.
- Downtrend (Bearish): Lower highs and lower lows.
- Sideways Trend (Ranging): Prices oscillating between support and resistance levels.
- SMA (Simple Moving Average): Gives equal weight to all data points.
- EMA (Exponential Moving Average): Places more emphasis on recent prices, making it more responsive to market changes.
- Ignoring the big picture.
- Overloading on indicators.
- Chasing trends.
- Poor risk management.